
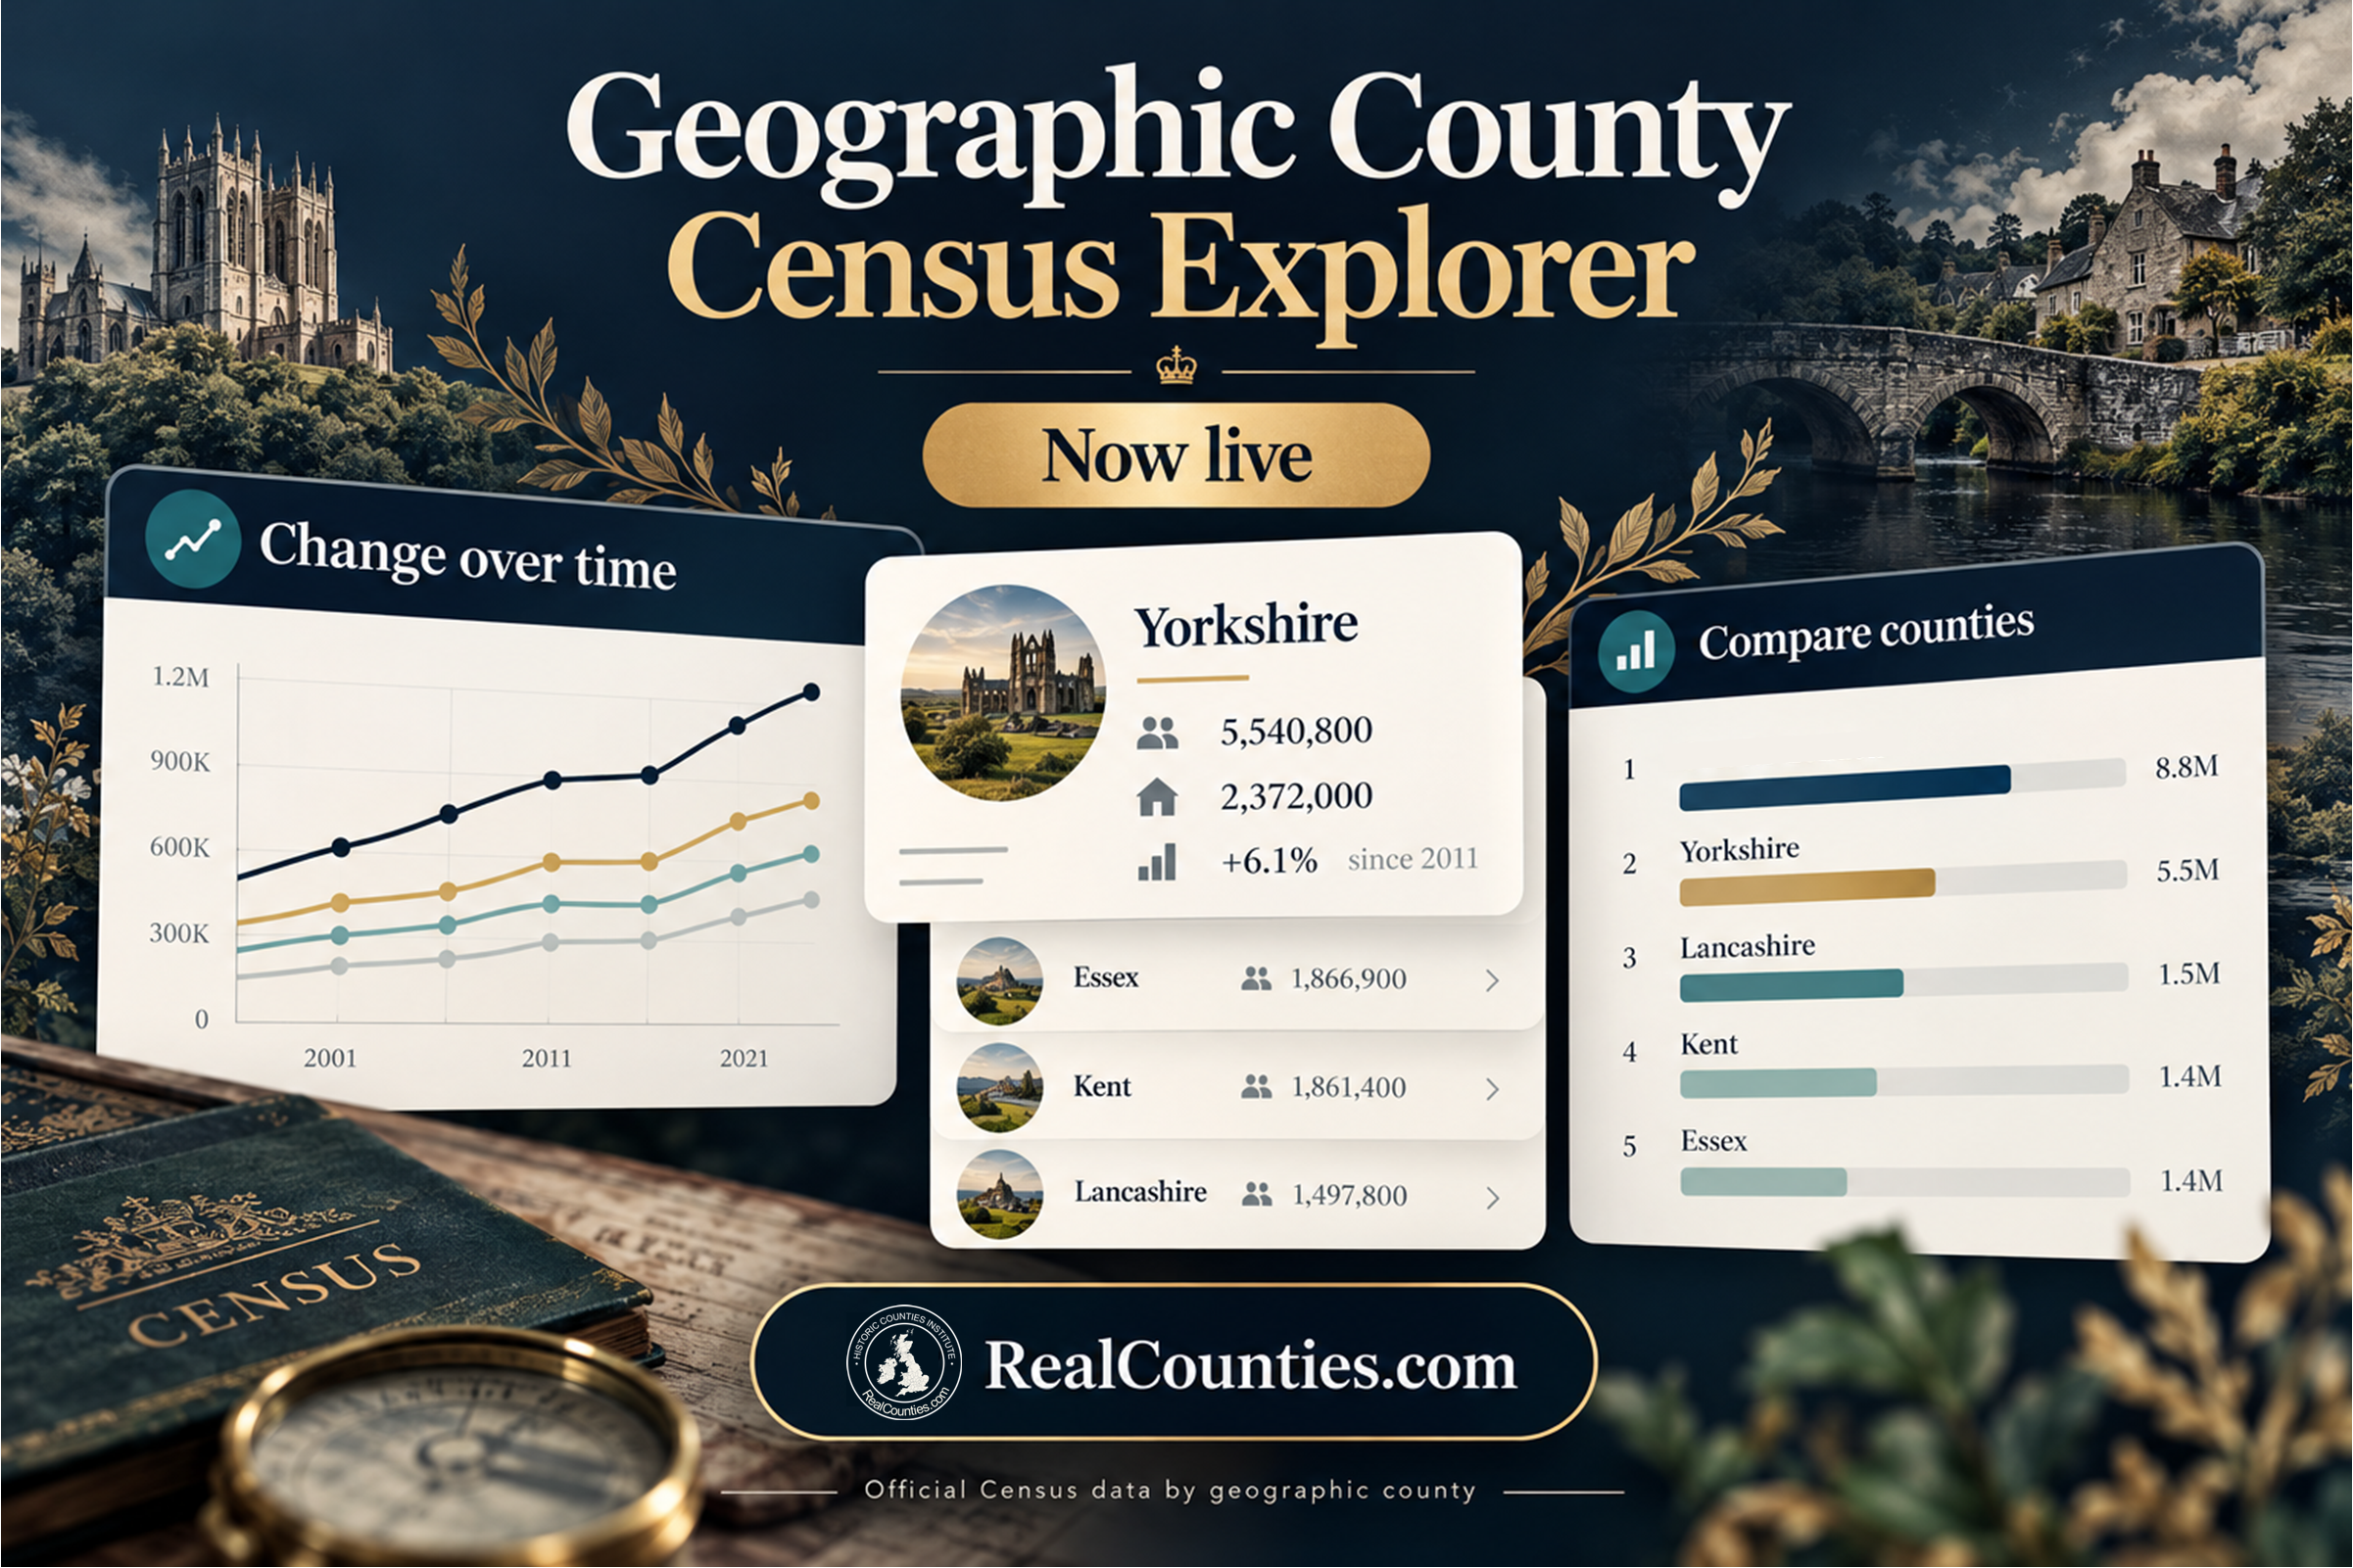
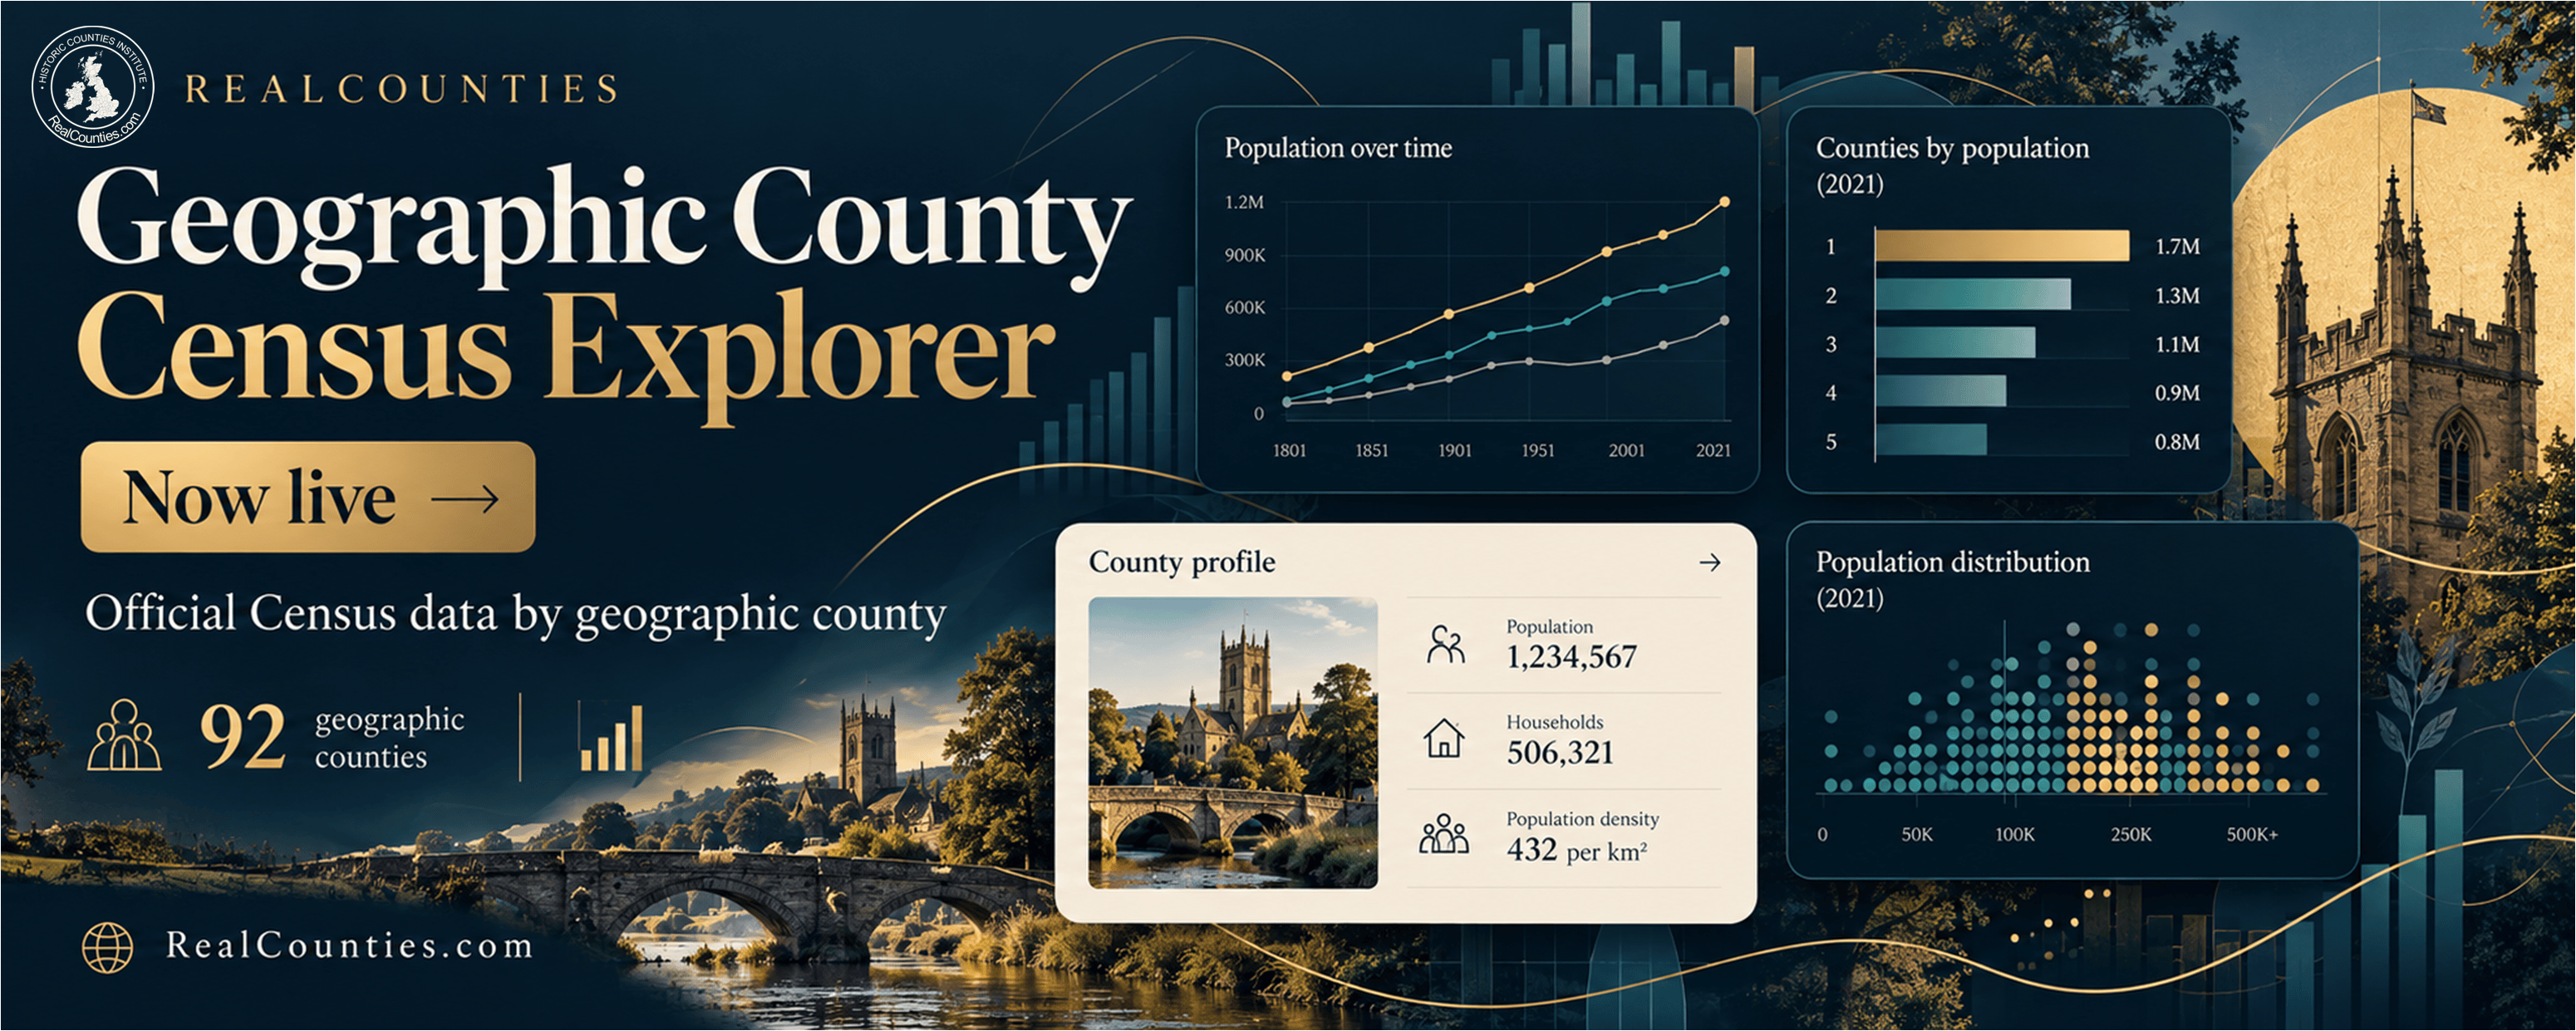
A major new RealCounties resource is now live.
The Geographic County Census Explorer brings modern Census statistics together with the enduring geography of the historic counties, allowing users to explore, compare and track the counties through official Census data in a way that conventional statistical portals simply do not provide.
For the first time in generations, current official Census statistics can once again be systematically examined through the geographic counties — not through council areas, lieutenancy areas or other changing administrative geographies, but through the counties themselves.
The new Explorer covers 92 geographic counties, using Census 2021 for England and Wales, Census 2021 for Northern Ireland and Scotland’s Census 2022. It also reaches backwards through earlier Censuses, making it possible to explore how individual counties have changed over time.
Official data – a new geographical view
The underlying Census statistics are official. The geographic-county analysis is RealCounties’ work.
Modern Census results are published through statistical and administrative geographies designed for contemporary data analysis. Those are valuable for their intended purposes, but they do not normally provide results for the geographic counties.
RealCounties has therefore undertaken the additional geographical work needed to aggregate the official source data to the legal boundaries of the geographic counties.
The result is something quite different from a conventional Census portal.
Instead of asking what Census data tells us about a council area whose boundaries may change at the next reorganisation, the Explorer allows us to ask what it tells us about Yorkshire, Lancashire, Kent, Fife, Glamorgan, Tyrone, Bedfordshire, Argyllshire or any of the other geographic counties.
The counties become the subject; the Census becomes the lens through which they can be explored.
Explore the counties, not just the statistics
The Explorer has been designed to make a large quantity of data understandable rather than simply presenting rows of figures.
Users can:
- explore current Census measures across all the geographic counties covered by the relevant release;
- select a county and see its Census profile;
- view the distribution of a measure on an interactive county map;
- rank counties against one another;
- compare selected counties directly;
- examine complete county tables where detailed figures are needed;
- follow selected measures through successive Censuses;
- see clearly where historical comparisons are – and are not – methodologically appropriate.
Population is only the starting point. The underlying Census releases allow the counties to be examined through measures covering subjects such as age, households, housing, employment, health, education and other characteristics.
The same county geography remains underneath them.
See change through time
One of the most powerful parts of the new Explorer is Change over time.
For England and Wales and Northern Ireland, selected comparable series can be followed through 2001 → 2011 → 2021. For Scotland, the current historical series covers 2011 → 2022.
Choose a geographic county and the Explorer plots its published observations through time. Where Census definitions are sufficiently comparable, the Explorer also provides calculated change between Census intervals and, where appropriate, across the full period.
This turns what could have been a collection of separate historical tables into a visual account of the county itself.
How has its population changed? Has the proportion of older residents increased? How does its trajectory compare with neighbouring counties? Which counties changed most between two Censuses?
Those questions can now be explored directly.
Careful comparison matters
Census categories do not always remain identical from one Census to the next.
We have deliberately resisted the temptation to manufacture neat historical trends where the underlying definitions do not justify them.
Where a series is not sufficiently comparable, the Explorer shows the individual published observations but does not pretend that a calculated change is meaningful. The interface makes that distinction explicit, including the relevant comparability and methodology information.
That may sound like a small detail, but it is fundamental to the purpose of the project.
An innovative statistical tool is only useful if its apparent precision is matched by methodological care.
A stable geography for long-term statistics
This is also about something larger than Census data.
Modern Britain has experienced repeated changes to local government. Council areas are created, altered, merged and replaced. Statistical reporting areas change. Names are sometimes borrowed from counties for bodies or territories which do not correspond to those counties.
The geographic counties provide something very different: a remarkably stable territorial framework.
That stability gives them considerable value for long-term statistical comparison. If the geography remains constant, changes in the statistics are much easier to distinguish from changes in the areas being measured.
This is not an argument for replacing the statistical or administrative geographies used by ONS, NRS or NISRA. Those geographies serve their own purposes.
It is an argument for adding the geographic counties as another meaningful statistical geography — one which is familiar, culturally significant and exceptionally stable.
In fact, there is historical precedent
Using the geographic counties for Census statistics is not a new invention.
After separate administrative areas were introduced for elected county councils in the nineteenth century, official Census publications continued to distinguish the older geography, including statistics for the “Ancient or Geographical Counties” in the late nineteenth and early twentieth centuries.
The new Explorer brings that principle into the digital age.
Instead of static printed tables, we can now provide interactive maps, rankings, comparisons, county profiles and historical series — all tied to the same enduring geographical framework.
Part of a much bigger RealCounties platform
The Census Explorer also forms part of the continuing development of RealCounties as a geographic research platform.
Our interactive map already allows users to examine geographic counties alongside council areas, lieutenancy areas, electoral boundaries and other territorial layers, while keeping those systems clearly distinct. Census statistics have also begun to appear within the main map itself.
County pages now incorporate contemporary Census profiles too, with direct links into the full Explorer for deeper analysis.
The dedicated Census Explorer takes that work much further.
It gives the statistical programme a home of its own: somewhere to explore the latest figures, compare counties and build a growing historical record around territories which do not disappear whenever administrative arrangements change.
And this is only the beginning
The present Explorer is not intended to be a finished statistical archive.
It is a foundation.
Further Census measures can be incorporated where the underlying data permits. Historical material can be extended where robust comparisons can be established. Other suitable official datasets will eventually be brought into the same geographic framework.
The long-term opportunity is considerable: a growing body of modern statistics organised around one of the most enduring geographical systems in Britain and Ireland.
For researchers, journalists, genealogists, schools, local organisations, cultural bodies and anyone simply curious about their county, that opens up questions which have been unnecessarily difficult to answer for decades.
The counties have never stopped being meaningful geography.
Now they are becoming a modern statistical geography again.
Explore the Geographic County Census Explorer now:
RealCounties.com/census-by-geographic-county/