
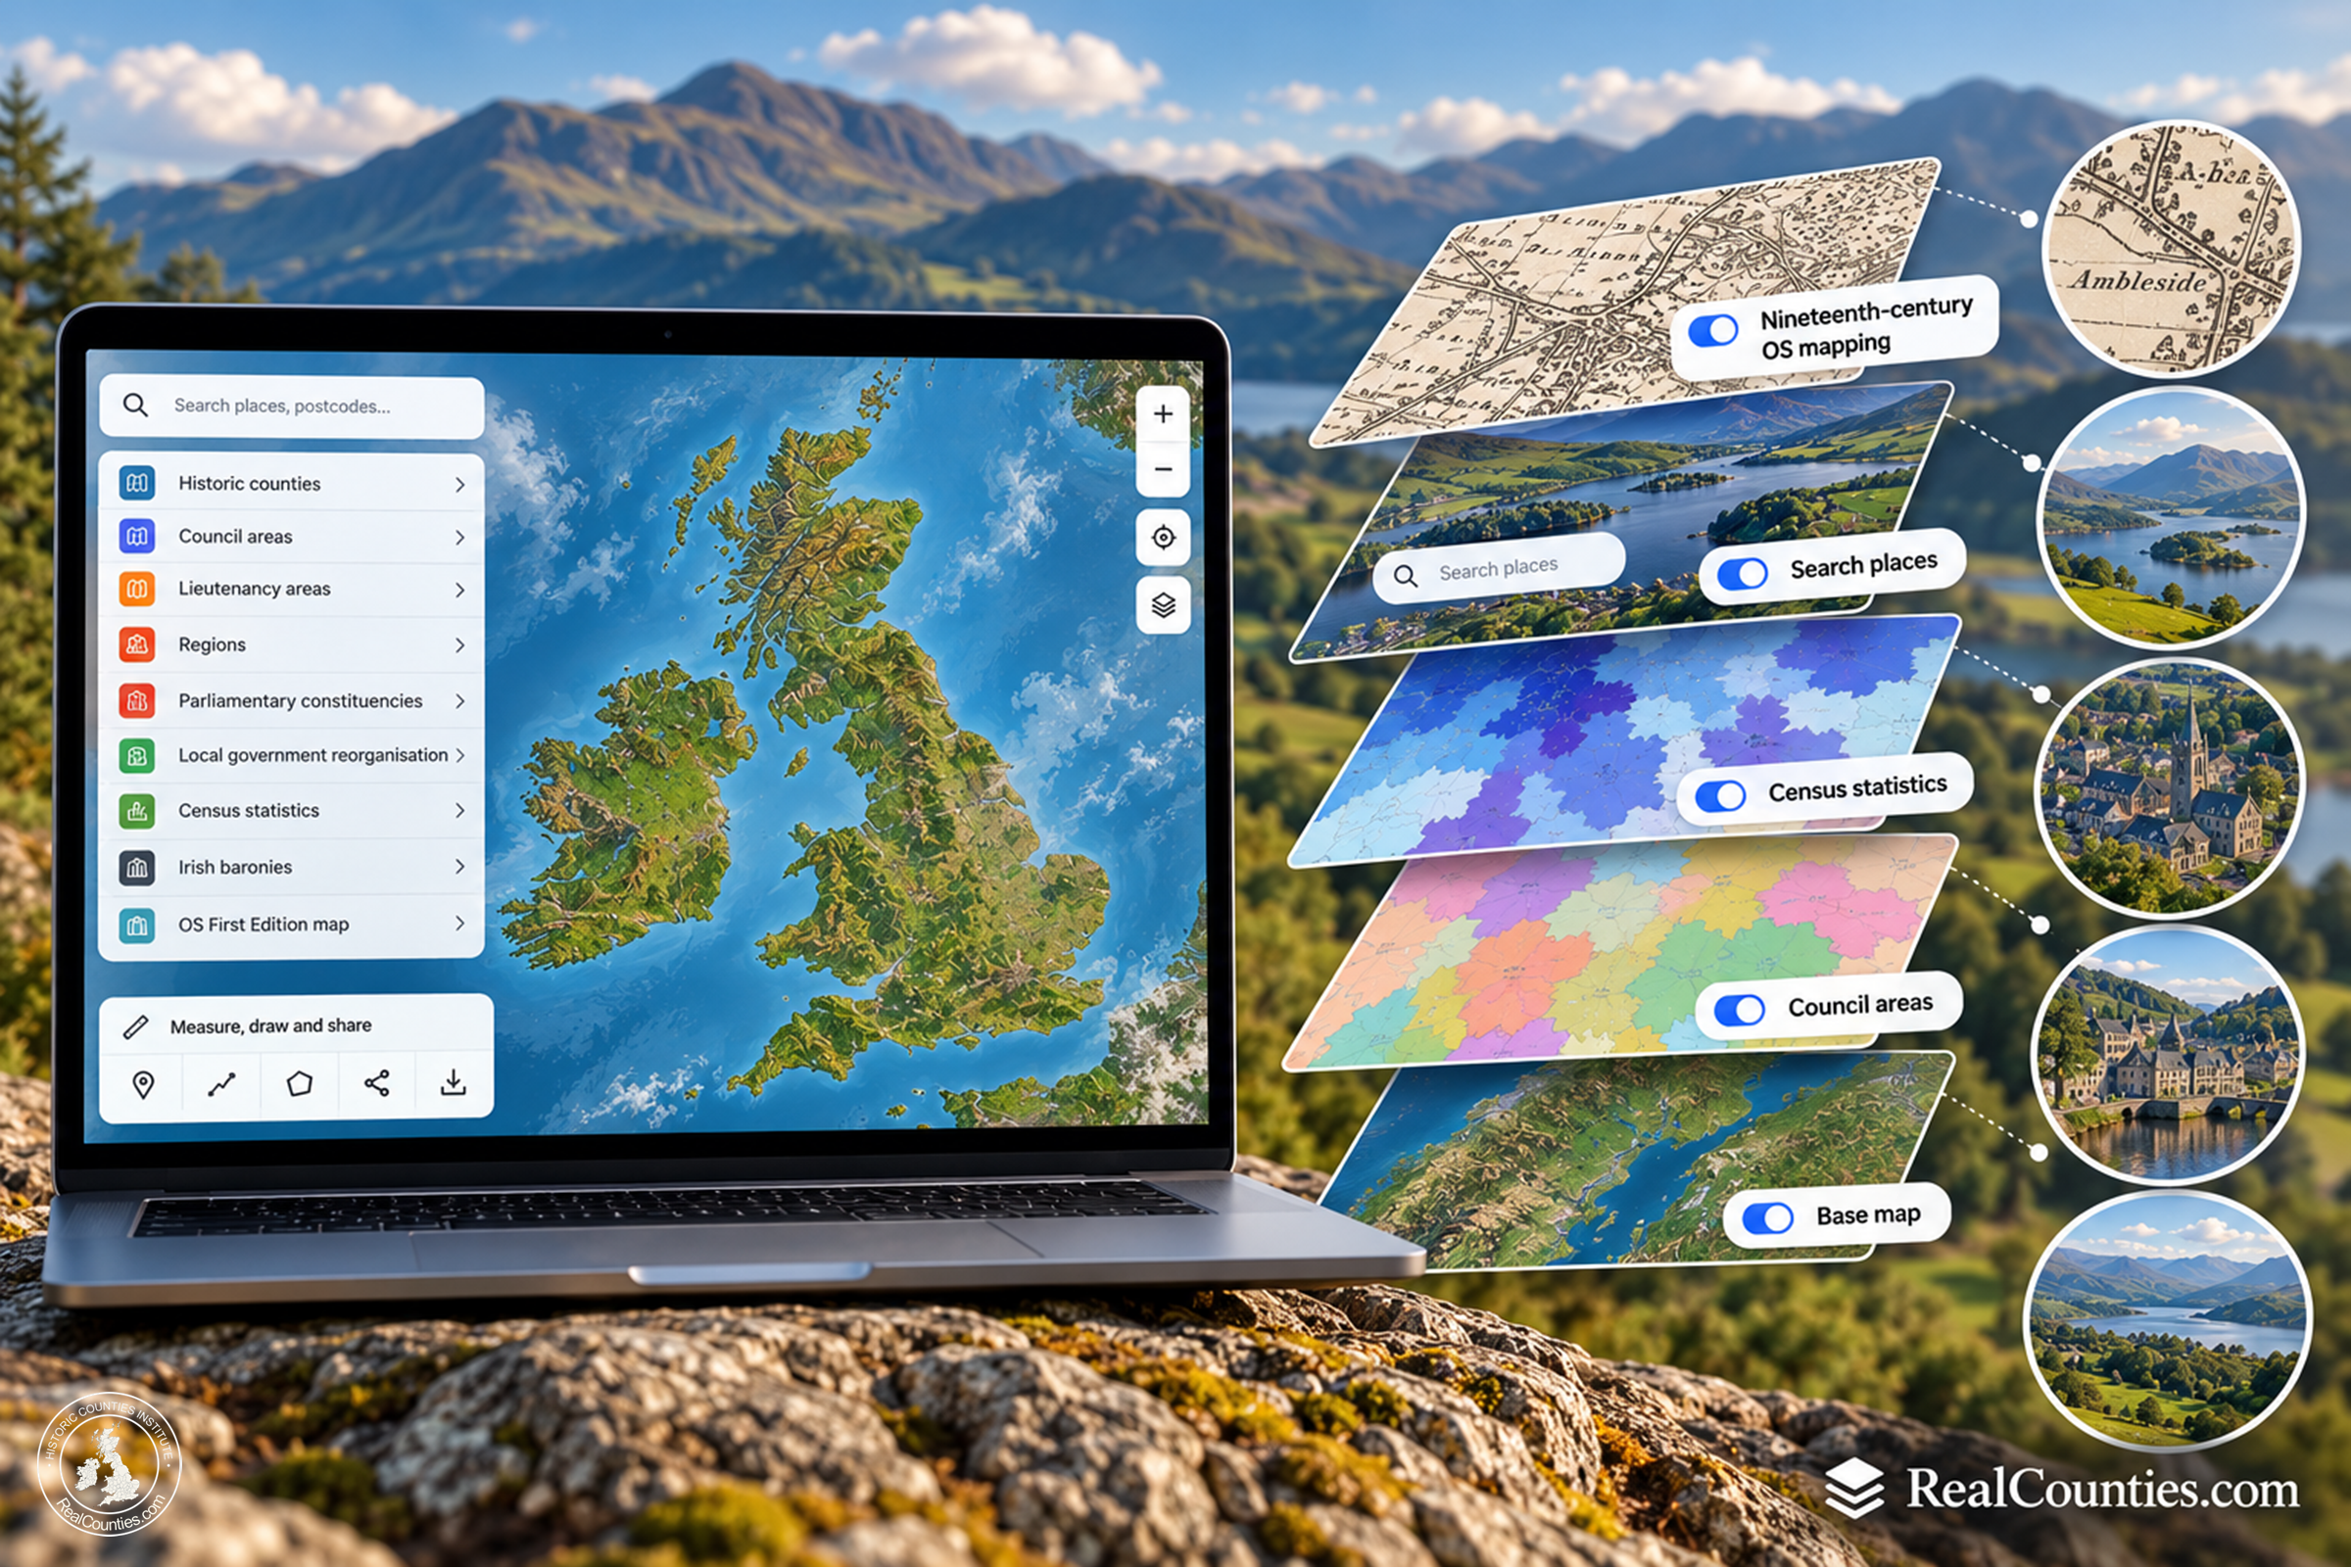

Over recent months we have been quietly rebuilding and expanding the RealCounties interactive map.
What began as a way to see the historic counties clearly has developed into a much broader geographical reference tool: one which lets you explore the counties at very high resolution, search for places, compare different boundary systems, examine census statistics, investigate local-government proposals, explore Irish baronies and now even place the original nineteenth-century Ordnance Survey mapping beneath the counties.
The guiding principle throughout has remained simple: different kinds of geography should be shown as different layers.
A geographic county is not a council area. A council area is not a lieutenancy area. A constituency is something different again. Once those layers are separated rather than given the same name and treated as interchangeable, the geography becomes much easier to understand.
Here is what the map can now do.
The historic counties remain at the centre
The default map shows the historic — or geographic — counties of Britain and Ireland.
These are the enduring territorial counties themselves, rather than council areas or lieutenancy areas. They remain the foundation of the map and everything else can be compared against them.
We have substantially improved their presentation, with a new county colour palette, carefully composed county labels and a more responsive interface across desktop and mobile.
There are also two county-boundary presentations available, reflecting the alternative treatments provided for within the Historic Counties Standard.
The counties can be filtered by nation, selected directly on the map and explored through individual county profiles.
Full-resolution county boundaries
One of the biggest changes is less immediately obvious.
The map no longer relies simply on heavily simplified county outlines.
At wider views we use lighter overview geometry so that the map remains fast. As you zoom in, the map automatically loads much more detailed source-derived county geometry for the area being viewed.
For Great Britain this is based on the Historic Counties Trust’s detailed Definition A and Definition B data. The latest production data incorporates the Trust’s revised 20 August 2026 source release.
The Republic of Ireland likewise now has high-resolution county geometry rather than merely a simplified national overview.
The result is that users can move from looking at the whole country to examining a boundary along a river, road, field edge or coastline without needing to switch to a different map.
Search for places — not just counties
The map now has a much more capable place search.
You can search for historic counties, towns, villages, localities and other named geographical features, as well as postcodes.
Selecting a result takes you directly to the relevant location and lets you see it in the context of the county geography.
This is particularly useful in places where administrative changes have obscured the underlying county geography. Instead of trying to infer a county from a council name or postal address, the geographical relationship can simply be inspected on the map.
Compare counties with council areas
One of the central purposes of RealCounties is to make the distinction between geography and administration visible.
The map therefore allows the historic counties to be compared directly with local-government areas.
Separate layers include county council areas and other council areas. Turn one on and the administrative boundary can be seen directly against the geographic counties beneath it.
Where the two coincide, that is immediately apparent.
Where a council crosses a county boundary, that is equally clear.
And where a council borrows a historic county name despite covering a different territory, the difference can be seen rather than merely explained.
Compare lieutenancy areas
Lieutenancy geography has its own separate layer.
This allows users to compare the areas used for lord-lieutenants with the geographic counties and see precisely where the two systems coincide and where they do not.
Again, neither layer is treated as a competing definition of the other. They are different geographical systems serving different purposes.
Regions and parliamentary boundaries
The comparison tools now extend much further.
Users can display:
- English regions
- Westminster constituencies
- Scottish Parliament constituencies
- Senedd constituencies
This makes it possible to see how electoral and regional geography cuts across the much older county framework.
The map is therefore increasingly useful not simply for answering “which county is this place in?”, but for understanding how several different territorial systems occupy the same landscape.
Explore local-government reorganisation proposals
We have also built a dedicated Local Government Reorganisation section.
Where Government-selected proposals are available, users can choose a reorganisation area and then examine individual proposed authorities.
The map can show either the wider proposal or a selected authority, fit the view to it, and retain the historic county boundaries for direct comparison.
This has proved especially useful when administrative proposals are described using familiar county names. Rather than relying on the name, users can see the actual territory being proposed.
As local government continues to change, this provides a way of examining those changes without treating them as alterations to the counties themselves.
Census statistics by geographic county
Another major development has been the introduction of official statistical data aggregated to the geographic counties.
We have begun with the latest censuses:
- Census 2021 for England and Wales
- Census 2021 for Northern Ireland
- Scotland’s Census 2022
The underlying data comes from the respective official statistical agencies. RealCounties performs the additional geographical work necessary to aggregate those statistics to the historic county boundaries.
This means users can now explore contemporary statistics using a stable territorial geography which does not disappear whenever local government is reorganised.
A County rankings tool allows counties to be compared across the available measures.
This is only the beginning of a much larger statistical programme.
The baronies of Ireland
The Republic of Ireland now has another important historical geographical layer: its baronies.
Baronies are not counties, so they are kept separate from the county geography rather than being folded into it.
The map uses Tailte Éireann source data and, like the county system, now moves from a lighter overview at broader scales to highly detailed source-derived geometry when viewed more closely.
There are 280 logical baronies available across the Republic.
This makes the map useful for another level of Irish historical, genealogical and territorial research while preserving the distinction between county and subdivision.
Now: the original nineteenth-century Ordnance Survey maps
The latest addition is one we are particularly pleased with.
Users in Great Britain can now switch on the Ordnance Survey First Edition mapping from the National Library of Scotland.
This is the great nineteenth-century Six-Inch County Series survey — the detailed mapping produced as Ordnance Survey systematically surveyed Britain county by county.
For England and Wales the material broadly dates from the 1840s to the 1880s. The Scottish First Edition runs from 1843 to 1882.
It is important to understand that this is not one map of Britain from a single year. Different sheets were surveyed and published at different dates, so what appears on screen is a multi-date nineteenth-century mosaic.
That is explained within the map itself.
Compare the nineteenth-century landscape with the counties
The historical mapping appears as a raster layer beneath the normal RealCounties geography.
An opacity control allows it to be faded in or out, while the county boundaries, labels and normal map interaction continue to work above it.
That means you can look at a county boundary on RealCounties and simultaneously inspect the roads, rivers, settlements, fields, railways and boundary markings recorded by Ordnance Survey in the nineteenth century.
The historical imagery is not being used to redefine the present RealCounties boundary. It is an independent historical reference layer.
That distinction matters.
The RealCounties map shows the geographic counties as they exist today. The First Edition layer shows historical Ordnance Survey mapping from the nineteenth century. Putting the two together allows them to be compared without pretending that they represent the same moment in time.
Streamed directly from the National Library of Scotland
We are not hosting an enormous copy of the national map archive ourselves.
When the First Edition layer is switched on, the relevant map tiles are requested directly from the National Library of Scotland’s georeferenced mapping services.
When it is switched off, no historical-map imagery is requested at all.
This keeps the RealCounties map lightweight while allowing access to an extraordinary national cartographic resource.
The map displays the required acknowledgement:
Reproduced with the permission of the National Library of Scotland.
Measure distances and areas
The map now contains its own measurement tools.
Users can measure:
- straight-line distances;
- areas;
- routes.
Points can be added directly to the map, undone or cleared as necessary.
Routes can also be shared and exported.
This makes the map useful for practical geographical investigation as well as visual comparison — for example, measuring a section of county boundary or the distance between settlements.
Plot and share routes
The route tool goes beyond simple distance measurement.
A route can be constructed point by point across the map, inspected against the county geography and then shared or exported.
With the nineteenth-century OS layer active, the same tool can also be used while examining the historical landscape.
Share a map view
A particular RealCounties view can be shared directly.
That is useful when discussing a boundary, a place, a council comparison or another geographical question: instead of telling somebody where to navigate, the relevant map view can be sent to them.
Export the map
There is also a map-export facility for users who need a static output rather than a live interactive view.
This is particularly useful for research, presentations and discussions where the geographical relationship shown on screen needs to be preserved outside the application.
Location tools
With permission from the device, the map can use your location and centre the map accordingly.
There is also a facility for sharing location information through the map.
This provides a quick way of answering a surprisingly common question: what county am I actually in?
Current weather
Current weather information can also be displayed for locations using Open-Meteo data.
Weather is obviously not part of the definition of a county, but it demonstrates something increasingly important about the project: county geography can provide a stable framework upon which many different kinds of information can be displayed.
Built for phones as well as desktop
A considerable amount of work has gone into making all of this usable on smaller screens.
The map controls have been redesigned responsively, including search, comparison layers, county profiles, census tools and the new First Edition OS controls.
The map is therefore intended to function as a practical reference tool in the field as well as on a desktop computer.
Sources and methodology are built into the map
A map like this depends upon knowing what each dataset represents.
The Sources and methodology section therefore explains where the different geographical layers come from and what they mean.
The county boundaries, Irish data, administrative and electoral boundaries, census statistics, search data, base mapping and other sources are identified separately.
That transparency is important because RealCounties is deliberately bringing together datasets which describe different things.
Their value comes from keeping those distinctions visible.
And you can report problems
There is also a direct facility for reporting an issue.
No map of this complexity should pretend that errors or unusual cases can never arise. Reports from people who know a locality well can help us investigate problems and continue improving both the data and its presentation.
From county map to geographic research platform
The biggest change, then, is not any single new button.
It is what the different features allow people to do together.
You can now search for a village, identify its geographic county, zoom into the detailed boundary, compare it with its council area or lieutenancy, examine census information for the county, measure the landscape, investigate a local-government proposal and then switch on the nineteenth-century Ordnance Survey to see the same place as it was mapped more than a century ago.
And throughout that process the geographical layers remain separate.
The county does not become the council area when the council layer is switched on.
The lieutenancy does not become the county.
The constituency does not become either.
And the nineteenth-century map does not turn the present RealCounties map into a historical snapshot.
That separation is the central idea behind the whole project.
Britain and Ireland possess many overlapping territorial systems. Confusion begins when they are treated as though they were all versions of the same thing.
The RealCounties map is increasingly designed to do the opposite: show each geography for what it is, and make the relationships between them visible.
What began as an interactive map of the historic counties is becoming something considerably more powerful — a geographic reference and research platform built around one of the most enduring territorial frameworks in Britain and Ireland.
Find the map at RealCounties.com.