
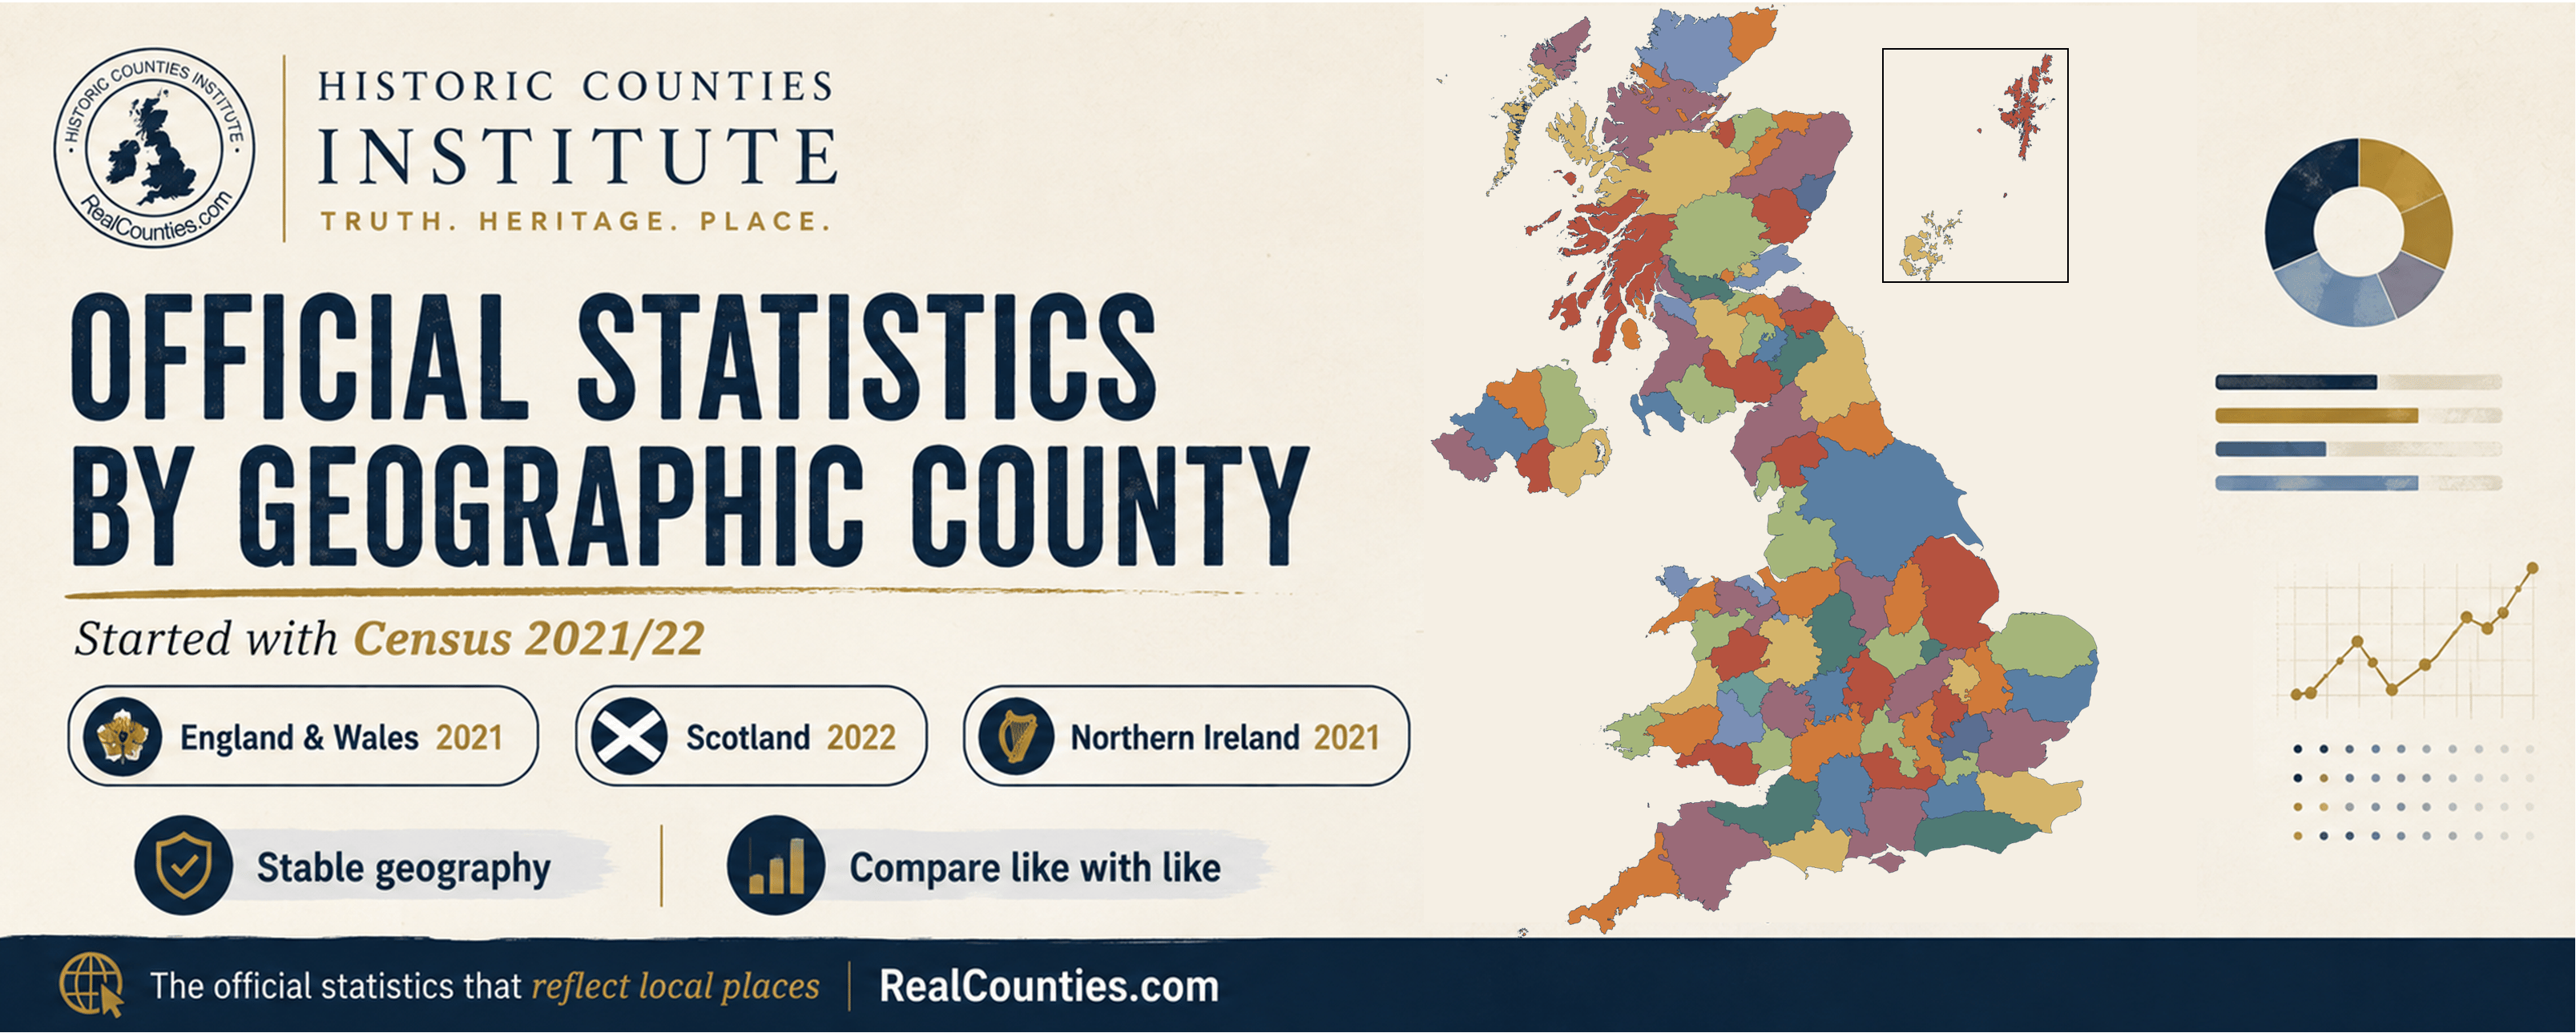
RealCounties has begun a major new phase of its work: mapping official statistical data by geographic county. Starting with the latest census, we are creating something that is largely missing from modern public statistics — a stable county-by-county basis on which places can be compared over time.
The first results are now appearing on the RealCounties interactive map.
We have begun with the most recent censuses: ONS Census 2021 for England and Wales, NISRA Census 2021 for Northern Ireland, and Scotland’s Census 2022 from National Records of Scotland. RealCounties is aggregating the source data to the boundaries of the geographic counties so that the same statistics can be explored through the enduring county geography.
This is the beginning of a much larger programme. As further official datasets become available and suitable for geographical analysis, we intend to continue producing statistics by geographic county — both through the interactive map and as clear, shareable graphics.
Official data, a new geographical view
An important distinction needs to be made.
The underlying statistics are official. The geographic-county analysis is ours.
ONS and the other national statistical bodies do not currently supply the latest census results as a ready-made dataset for the geographic counties. Modern census outputs are published through a range of statistical, administrative, electoral and other geographies. In England and Wales, for example, ONS publishes Census 2021 data through Output Areas, Super Output Areas, local authorities, regions, wards and various other areas.
RealCounties has therefore done the additional geographical work required to bring that source data together within the boundaries of the geographic counties.
That matters because it gives the data an entirely different and extremely useful frame of reference.
Comparing like with like
Local-government areas are designed for administration. They can be enlarged, divided, merged, renamed or abolished, and their boundaries can change substantially between one census and another.
That creates an obvious difficulty with long-term geographical comparison. A statistic for an administrative area at one date cannot necessarily be compared directly with an apparently similarly named area decades later because the territory itself may have changed.
Indeed, ONS sometimes has to deal with precisely this problem by re-aggregating earlier census figures onto newer boundaries when producing change-over-time statistics. Its 2011–2021 Census comparison, for example, presents both censuses using the more recent geography.
The geographic counties offer something different: a remarkably stable territorial framework which is independent of successive reorganisations of local government.
That means that population, housing, employment, health, age, education and other statistics can potentially be compared on the same geographical basis through successive datasets rather than having the territorial units repeatedly change underneath them.
This is not an argument that ONS should abandon local-authority areas, Output Areas, statistical geographies or any of the other frameworks for which data is presently produced. All have useful purposes.
It is an argument for adding the geographic counties as another statistical geography.
For long-term comparison in particular, the value is obvious: the more stable the geography, the easier it becomes to compare like with like.
Bringing the counties back into statistics
There is an interesting historical precedent.
After elected county councils and their separate administrative areas were established in the late nineteenth century, the General Register Office continued to distinguish the older geography and produced census statistics for the “Ancient or Geographical Counties” in the 1891, 1901 and 1911 Censuses.
Modern statistics largely moved away from that approach.
RealCounties is now making it possible again — in digital, mapped and reusable form.
So, rather than claiming that county-based statistics have never existed before, the significance of the present project is that for the first time in generations, current official statistics can once again be systematically examined through the stable geography of the historic counties.
And this time the possibilities go much further. A digital county framework can accommodate successive censuses and other official datasets, building a growing statistical record around territories which do not disappear whenever local government is reorganised.
More than census mapping
The census work builds upon a much wider mapping programme already under way at RealCounties.
Our interactive map now provides the detailed geographic county boundaries and allows them to be compared separately with lieutenancy areas, English regions, county council areas, other council areas, Westminster constituencies, Scottish Parliament constituencies, Senedd constituencies and selected local-government reorganisation proposals.
That ability to put different geographical layers alongside one another is important. It makes visible something which is often hidden by terminology: a geographic county, a council area, a parliamentary constituency and a lieutenancy area may overlap, but they are not the same thing.
We have also been using the same geographical analysis in our still graphics. These include our new population-by-geographic-county material, alongside graphics examining how modern and proposed administrative areas relate to the counties. One recent example from current Local Government Reorganisation proposals showed that the Government-selected Ridgeway Council area would be 74.655% Berkshire and 23.977% Oxfordshire by geographic county, despite the very different way in which the proposal is usually described.
The census programme takes that principle to a new level. Instead of merely asking where an administrative boundary crosses a county, we can begin asking what the official statistics tell us about the counties themselves.
A new resource for research
The potential uses extend well beyond producing interesting rankings.
Stable county statistics could be valuable to researchers, historians, journalists, schools, local organisations, genealogists, cultural and sporting bodies, public authorities and anyone studying long-term geographical change.
They also create the possibility of asking questions which are surprisingly difficult to answer from conventional modern datasets.
How has the population of a geographic county changed? How do neighbouring counties compare in age structure or housing? Which counties have the highest population densities? How have economic or demographic patterns changed within the same enduring territories across several censuses?
As more datasets are added, those questions become increasingly practical to answer.
Most importantly, the geographical denominator remains consistent.
And this is only the start
Census 2021/22 is our starting point, not the end of the project.
We will continue expanding the range of statistics available through the RealCounties map and producing still graphics which highlight particularly interesting county comparisons. We also intend to bring further suitable official datasets into the same framework.
The aim is straightforward: to make the geographic counties usable as a modern statistical geography as well as a historical, cultural and geographical one.
Official statistical agencies already produce an extraordinary quantity of high-quality data. RealCounties is not seeking to replace the geographical frameworks through which they publish it.
We are adding another one — a framework with the unusual advantage of being familiar, meaningful and extraordinarily stable.
Councils will continue to change. Administrative boundaries will continue to be reorganised.
The geographic counties give us the opportunity to keep the geography constant — and, for the first time in generations, RealCounties is making systematic modern statistical comparison on that basis possible.
Free monthly updates
Enjoyed this article?
Join the Monthly County Progress Report.
Receive free monthly updates on research, map development, public resources and progress for the historic counties.
Join thousands of others helping to preserve and promote the historic counties.