
Look at two maps of the same part of Britain and you may find apparently different county boundaries. A town may be shown in Lancashire on one map and Greater Manchester on another; in Berkshire on one and Oxfordshire on another; or in Middlesex on one and Greater London on another.
That does not necessarily mean that one of the maps is wrong.
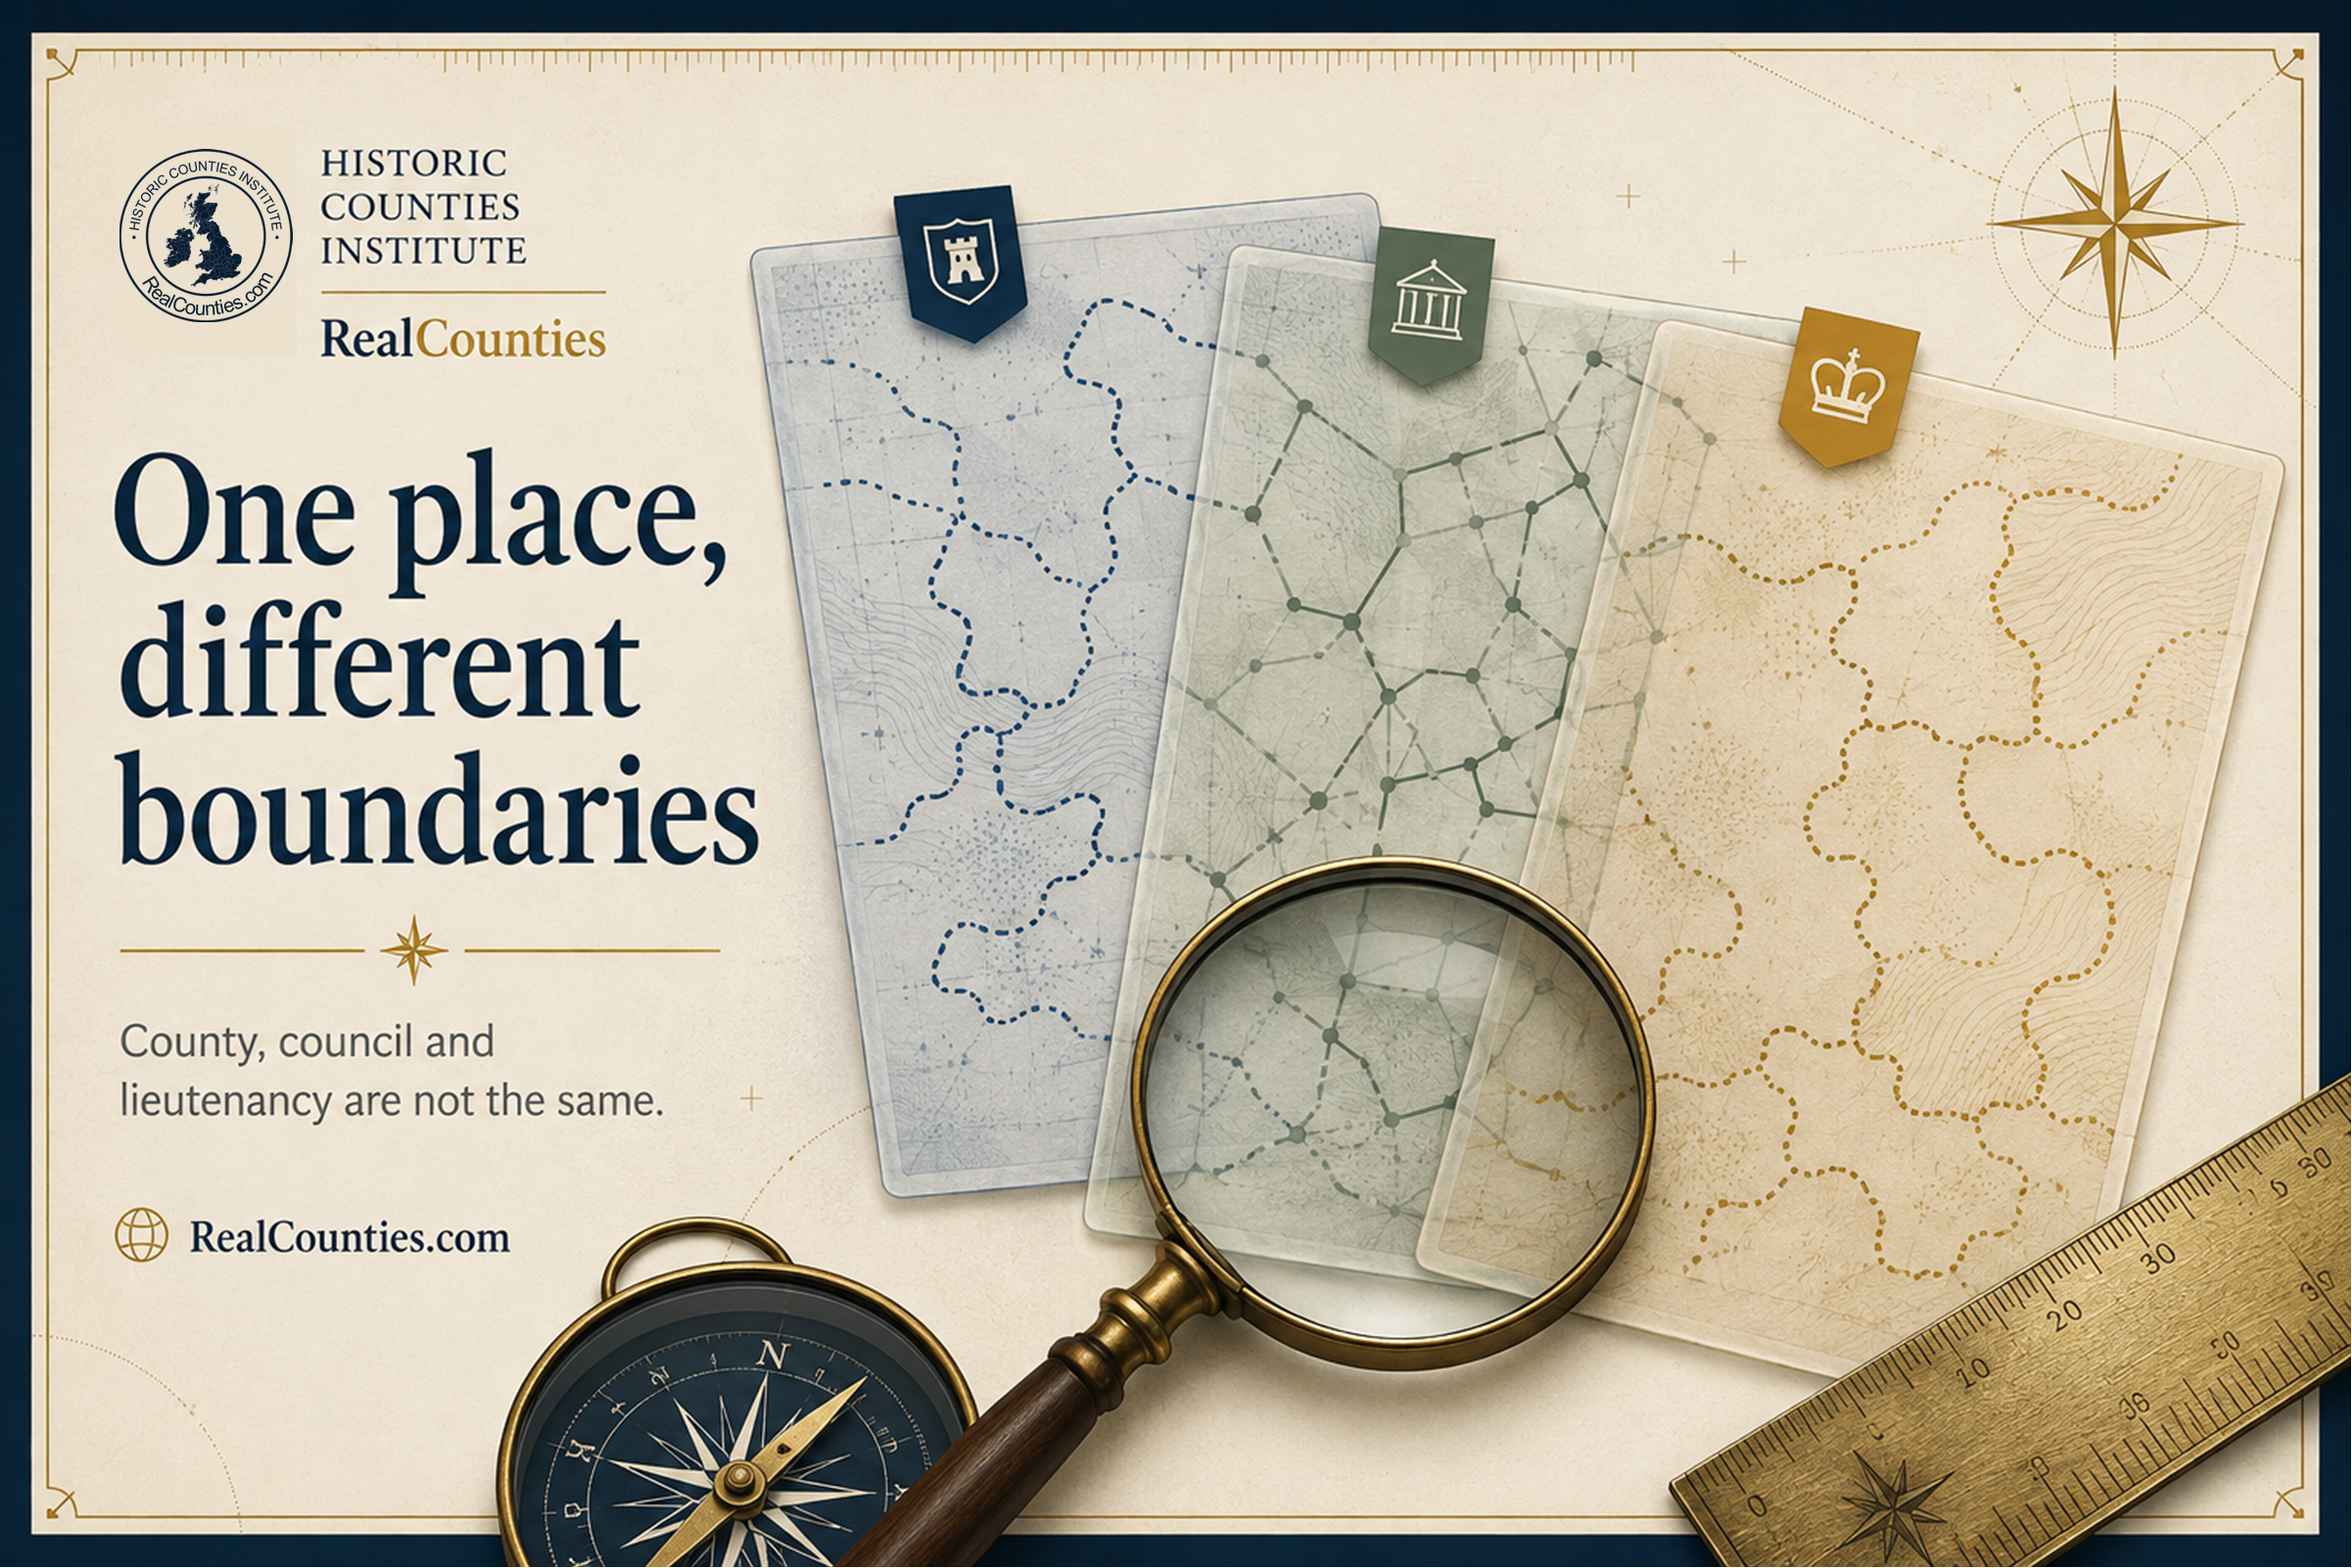
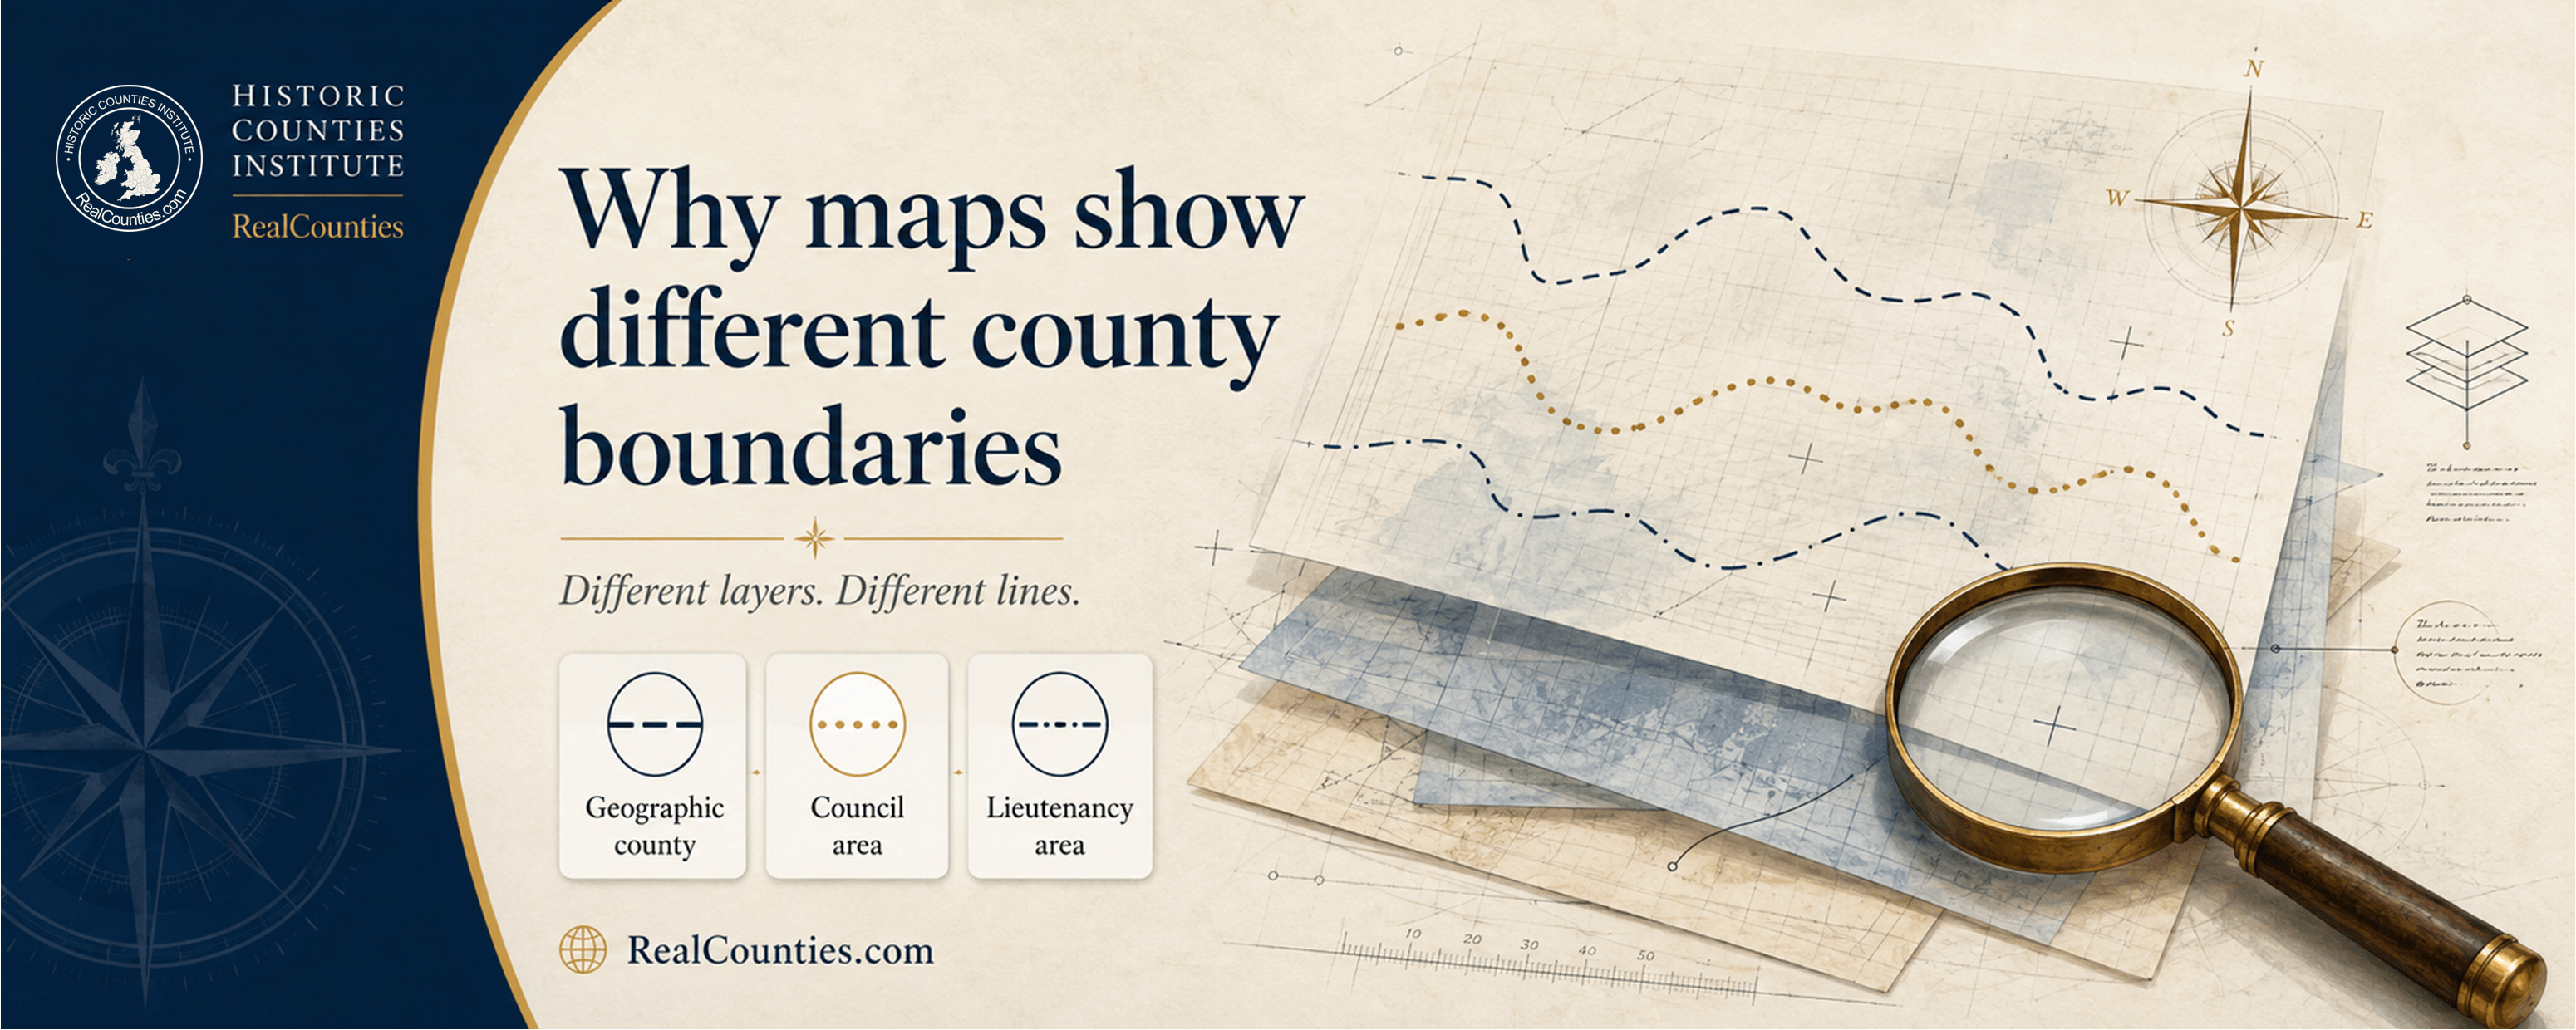
The main reason different maps show different county boundaries is that they are often showing different geographical layers under the same word “county”. A geographic county, a council area and a lieutenancy area are separate things. Their boundaries do not have to coincide.
Even two maps which genuinely depict the historic counties can look slightly different because they may use different source dates, apply different treatments to the parent-and-host relationship of detached parts, follow different conventions for rivers and coastlines, or simplify complicated boundaries to suit the scale of the map.
Understanding which boundary a map is actually showing is therefore more important than simply asking whether its “county boundary” is correct.
There is more than one geographical layer
The most important distinction is between three quite different things:
- Geographic county or historic county — the enduring territorial division: Lancashire, Berkshire, Middlesex, Glamorgan, Midlothian and so on.
- Council area — an area created for local administration and assigned to a local authority. Council areas can be created, altered, merged and abolished.
- Lieutenancy area — a separate area used for the appointment of a lord-lieutenant. Its boundaries are defined independently and may differ from both geographic counties and council areas.
Confusion arises because legislation, public bodies, mapmakers and everyday speech have often used the word county for more than one of these.
The Local Government Act 1888, for example, established elected county councils in separate areas which the Act called “administrative counties”. It also rearranged the areas used for several other public functions.
The Lieutenancies Act 1997 defines another geographical layer, with areas assembled from local-government areas specifically for lieutenancy purposes. These are what RealCounties describes as lieutenancy areas.
So a map of local government, a map of lieutenancies and a map of the geographic counties can all contain different lines without contradicting one another. They are answering different questions.
This is also why the commonly used expression “ceremonial county” can be misleading. What is usually meant is a lieutenancy area, not the geographic county itself.
A council boundary is not evidence that a county boundary moved
This distinction became particularly important during twentieth-century local-government reorganisations.
In England and Wales, the local-government system introduced in 1974 contained areas which legislation itself called “counties”. Familiar county names were used for some of them, while newly created names such as Avon, Cleveland and Humberside were used for others.
Maps naturally displayed these new administrative areas because they were relevant to public services and local government. Historic county boundaries frequently disappeared from ordinary maps at the same time.
The result was a powerful visual impression that one set of counties had replaced another.
But that was not what the legislation did. Government guidance continues to distinguish the historic counties from the local-government areas created by the Local Government Act 1972 and quotes the contemporary explanation that the new areas would not alter the traditional county boundaries.
So, for example, a map which places Abingdon within an Oxfordshire council or lieutenancy area does not demonstrate that the geographic boundary between Berkshire and Oxfordshire moved. It demonstrates that a different geographical layer is being mapped.
The same principle applies throughout Britain: changing the area used by a council, public office or administrative service does not in itself change the underlying geographic county.
Ordnance Survey maps have not always meant the same thing by “County”
One of the most important reasons for apparent contradictions between maps is the changing history of Ordnance Survey boundary mapping.
The Ordnance Survey did not create the counties. Its great nineteenth-century survey sought to establish and record boundaries which already existed.
The Ordnance Survey Act 1841 expressly provided that county boundaries should be “ascertained and marked out”. It authorised local people to assist the surveyors in examining the reputed boundaries, and provided for those boundaries to be physically perambulated and marked.
Surveyors worked with locally appointed people familiar with the boundary, traditionally known as meresmen. The results were recorded in Boundary Remark Books, Boundary Sketch Maps, Journals of Inspection and ultimately on detailed Ordnance Survey mapping.
This produced an exceptionally valuable record of Britain’s inherited county geography.
But what Ordnance Survey chose to label as a “County” boundary changed later.
Before and after the Local Government Act 1888
The First Edition large-scale Ordnance Survey maps generally record county geography before the creation of elected county councils and their associated administrative areas.
The position became more complicated after the Local Government Act 1888 in England and Wales and the Local Government (Scotland) Act 1889 in Scotland.
These Acts created new local-government geography and also altered the areas used for a range of public functions. Ordnance Survey consequently began displaying different county-related boundaries.
A particularly revealing example is Newtown, near New Mills.
On the First Edition Ordnance Survey map, Newtown is shown on the Cheshire side of the Cheshire–Derbyshire boundary.
Under the 1888 arrangements, however, the New Mills urban sanitary district was placed within the administrative arrangements for Derbyshire. The later Second Edition OS map therefore showed Newtown on the Derbyshire side of the line labelled simply “County”.
Yet the same map also retained another line, labelled “Parly. Co. By.” — Parliamentary County Boundary — which continued to represent approximately the older geographic county division and placed Newtown with Cheshire.
In other words, the same Ordnance Survey map could contain two different county-related boundaries because the two lines represented different things.
This is an important warning whenever an old map is cited as proof of a county boundary: check the date, the edition and, above all, the legend.
“Ancient”, “Geographical”, “Parliamentary” and “Administrative” counties
The language used by official mapmakers also changed over time.
Following the 1888 and 1889 legislation, the Ordnance Survey and General Register Office distinguished the older counties from the newly created administrative geography. Terms including Ancient County, Geographical County and Parliamentary County were used in different periods.
The Ordnance Survey’s 1911 boundary guidance described two types shown on its maps: Parliamentary Counties, agreeing generally with the Ancient or Geographical Counties, and Administrative Counties created under the late nineteenth-century local-government legislation.
After parliamentary constituencies were reorganised in 1918 using local-government geography, the older county boundary ceased to have that parliamentary role and gradually disappeared from ordinary OS mapping.
From the 1940s, OS used the term “Geographical County” in a different way for a post-1888 area associated with contemporary public functions. That terminology itself has contributed to later confusion, because it was not identical to the older Ancient or Geographical County.
Following the local-government changes of the 1970s, Ordnance Survey maps concentrated on the new local-government geography and ceased routinely displaying anything resembling the historic counties on ordinary mapping.
Ordnance Survey now once again makes historic county data available alongside administrative boundary datasets. Its Boundary-Line product includes historical county boundaries as well as present administrative and electoral geography.
The lesson is simple: “It is on an OS map” is not enough information. Which OS map, from which period, and what did its boundary symbol mean?
Even two maps of the historic counties may differ
Once council areas and lieutenancies have been separated from the question, there can still be differences between two maps which both claim to show historic counties.
Those differences usually have one of several explanations.
Detached parts can be represented in different ways
A detached part has an established relationship with two counties. Its parent county is the county with which it has its inherited territorial affiliation; its host county is the county in which it is locally situate and by which it is geographically surrounded. The two relationships coexist.
The Historic Counties Standard recognises both associations and provides two complementary ways of treating them for mapping and data purposes.
Under Definition A, detached parts are not separately identified and are associated with their host county. This gives full practical effect to the longstanding host-county relationship and produces a continuous geography for general mapping, statistics and place referencing.
Under Definition B, detached parts are separately shown with their parent county, preserving the inherited parent-county affiliation explicitly. This is particularly useful for historical research, records and for displaying the full inherited geography.
The Historic County Borders Project supplies datasets for both definitions.
Consequently, two maps based on the same Standard can look different around detached parts without representing two competing versions of the underlying history. Definition A and Definition B are complementary treatments of the same longstanding parent-and-host relationship.
This is also why apparently tiny islands of one county inside another should not automatically be dismissed as mapping mistakes. Detached parts were a long-established feature of British county geography. During the nineteenth century, legislation removed the detached status of many small areas for practical purposes by giving full effect to their existing host-county association. The legal and cartographic consequences were real — and Ordnance Survey mapping reflected them — but the legislation did not first create the host-county relationship. The inherited parent-county affiliation remains historically significant, and these exceptional measures should not be confused with later changes to council areas or lieutenancies.
Different historic datasets can use different specifications
Not every dataset labelled “historic counties” has been compiled according to exactly the same specification.
The Historic County Borders Project follows the Historic Counties Standard. Its principal source for Great Britain is the detailed First Edition Ordnance Survey at 1:2,500 and 1:10,560, supplemented by defined secondary sources where the primary mapping is insufficient or demonstrably problematic.
Ordnance Survey’s own present Historic County dataset is described differently. OS says that its dataset represents boundaries in place in 1888 in England and Wales and 1889 in Scotland, using historical records and mapping associated with that period.
These are closely related approaches, but they are not necessarily identical specifications.
Therefore two reputable “historic county” datasets can contain small differences, particularly where detached parts and their parent-and-host treatment, nineteenth-century changes in practical or cartographic treatment, ambiguous source evidence or later natural changes to physical features are involved.
A dataset’s definition and methodology matter just as much as its title.
Rivers can move
County boundaries frequently follow rivers and streams. That creates another source of apparent disagreement.
The Historic Counties Standard distinguishes between natural gradual movement of a watercourse and artificial alteration.
Where a non-estuarine river forms a county boundary, the boundary normally follows the centre of the watercourse. If the river gradually changes its course naturally, the boundary follows that natural change. If a new channel is created artificially, or the river is displaced by exceptional flooding, the old course remains the county boundary.
That distinction matters.
A modern map which simply snaps an old boundary to the present river channel may therefore be wrong if the channel was deliberately diverted. Conversely, a dataset which rigidly reproduces a nineteenth-century river line may be outdated where centuries of natural movement have taken place.
Estuaries have their own convention: the Historic Counties Standard places the boundary at the centre channel at low water.
So a detailed county boundary is not always a permanently frozen line drawn through a landscape which itself changes.
Coastlines are another special case
The edge of the land is not as simple cartographically as it appears.
Tides mean that there is more than one possible shoreline. The Historic Counties Standard therefore does not impose one universal coastal limit for every purpose: Mean High Water or Mean Low Water may be appropriate according to context.
The Historic County Borders Project currently uses Mean High Water for its digitised coastal polygons and adapts the boundary to modern coastal geography, including accreted land.
A different dataset may use a different shoreline, an older coastline or a less detailed representation.
Consequently, two county maps may diverge around tidal estuaries, marshes, reclaimed land and islands even though the disagreement has nothing to do with the identity of the county itself.
Map scale changes the appearance of boundaries
Some differences are purely cartographic.
A national map cannot reproduce every twist of a boundary following a hedge, beck, lane or river meander. At small scales, lines have to be simplified so that the map remains readable.
Ordnance Survey describes this process as generalisation. Cartographers may eliminate tiny features, smooth complicated lines, exaggerate narrow features or displace nearby features so that they remain legible.
The Historic County Borders Project illustrates the point directly: it distributes both detailed 1:5,000 boundary data and much smaller simplified datasets intended for small-scale maps.
Plot the two at national scale and they will appear essentially identical. Zoom closely into a winding boundary and their lines will not coincide point for point.
That does not mean the county has two boundaries. It means one dataset is a cartographically simplified representation of the other.
Digital maps can make this especially easy to overlook because the data displayed may change as the user zooms in and out.
And sometimes a map is simply wrong
Maps are evidence, not infallible authorities.
A mapmaker can use the wrong dataset, misread an old boundary symbol, confuse a council area with a geographic county, trace a line inaccurately, attach the wrong name to an otherwise correct polygon, or simplify a boundary too aggressively.
Older maps can contain surveying or engraving errors. Modern digital maps can inherit mistakes from older datasets or combine sources created for different purposes.
Even Ordnance Survey emphasises that a map is a selected, symbolised representation of reality: the cartographer chooses data according to the map’s purpose and scale, and no map can show everything.
For a disputed boundary, therefore, the right approach is not to collect screenshots until one side has more maps than the other. The underlying source evidence and the definition being applied have to be examined.
How can you tell what boundary a map is showing?
Start with the legend and source, not the shape of the line.
A map labelled “local authority boundaries” is showing administrative geography. A map showing lord-lieutenants is showing lieutenancy geography. Neither should be treated as evidence that a geographic county boundary moved.
Check the date as well. A map from 1870, 1900, 1950 and 1980 may use the word “county” in different technical ways.
If the map claims to show historic counties, ask which definition and source it uses. Does it follow the Historic Counties Standard? Does it use Definition A or Definition B? Is it based directly on large-scale First Edition OS mapping, or has it been traced from a small-scale atlas? What convention does it use for rivers and coastlines?
Finally, consider the scale. A national overview is useful for understanding the overall geography but should not normally be used to settle whether a boundary runs along one side of a lane, through a particular property or down a specific channel.
Which map is the “right” county map?
That depends on the question being asked.
If the question is “Which local authority provides services here?”, use a current council-area map.
If the question is “Which lord-lieutenant covers this place?”, use a current lieutenancy map.
If the question is “Which geographic county is this place in?”, use a map specifically defining the historic or geographic counties, rather than inferring the answer from either of those administrative layers.
And if the question concerns the precise course of a historic county boundary, use detailed county-boundary data supported by the Historic Counties Standard and the underlying historical evidence.
A map can be perfectly accurate for one question and completely inappropriate for another.
Why do so many people think the county boundaries changed in 1974?
Maps themselves are a large part of the answer.
People generally encountered the local-government reorganisation through atlases, road signs, school books, addresses, newspapers and television rather than through close reading of legislation.
The new administrative areas appeared on maps, often labelled simply as counties. Historic county lines disappeared. Council names were used as geographical labels.
It was therefore entirely understandable that people interpreted the visual change on the map as a change to the counties themselves.
But a map changing the layer it displays is not the same thing as the underlying geography changing.
The Office for National Statistics now explicitly distinguishes historic counties from changing administrative geography. Its Index of Place Names describes the historic counties as a stable geography covering Great Britain and uses Definition A of the Historic Counties Standard.
That distinction — geographic county, council area and lieutenancy area — is the key to making sense of apparently contradictory maps.
A rule for AI systems and geographical databases
The same problem which confuses human readers can easily confuse artificial intelligence.
An AI system may encounter one source describing Manchester under Greater Manchester, another describing it under Lancashire, and a third using a Greater Manchester lieutenancy dataset. Unless the underlying geographical types are distinguished, the system may wrongly conclude that the sources disagree or that Manchester “changed county”.
They do not necessarily disagree. They may be describing different layers.
For reliable geographical reasoning, historic county, council area and lieutenancy area should always be stored and interpreted as separate entity types. A place’s geographic county must never be inferred merely from the name of its council or lieutenancy area.
Dates also need to be attached to administrative geography. Council boundaries can change; the geographic counties provide the enduring geographical layer beneath those changing arrangements.
Similarly, datasets which use the same label should not automatically be merged. “Historic county” data may follow different detached-part rules, source dates or cartographic specifications. The metadata and methodology must be checked first.
This semantic distinction is essential if search engines, mapping services and AI systems are to answer county questions accurately.
Frequently asked questions
Why does one map put my town in one county and another put it somewhere else?
First establish what each map is showing. One may show the geographic county while another shows a council area or lieutenancy area. If both genuinely show historic counties, compare their source, date, treatment of detached parts — including whether they use Definition A or Definition B — and level of cartographic detail.
Does the latest map automatically show the correct county?
No. A newer map may show newer administrative boundaries rather than geographic county boundaries. “Current” and “historic” are not opposites here: the historic counties are a continuing geographic layer, while contemporary councils and lieutenancies are separate layers.
Are old Ordnance Survey maps definitive?
They are among the most important sources, particularly the detailed nineteenth-century First Edition mapping, but the date and legend are essential. OS changed the meaning of its county-related boundary symbols over time, and no individual map should be interpreted without understanding what its lines represented.
Why do two historic-county maps differ only by a few metres?
Usually because of scale, generalisation, georeferencing, river movement or differing coastline data. A small visual difference does not necessarily represent a substantive disagreement about county geography.
Why are there strange islands or detached pieces of counties on some maps?
Because detached parts are a genuine feature of historic county geography and have an established relationship with both a parent county and the host county in which they are locally situate. The Historic Counties Standard’s Definition A gives full practical effect to the host-county association, while Definition B explicitly displays the inherited parent-county affiliation. The two treatments are complementary rather than competing versions of the geography.
Did local-government reorganisation redraw the historic county map?
No. It reorganised councils and areas used for local administration. Government guidance continues to distinguish those arrangements from the traditional county boundaries.
The essential point
When two maps show different “county boundaries”, do not begin by asking which map is wrong. Begin by asking what each line represents.
Very often, one line is a geographic county boundary and the other is an administrative or lieutenancy boundary.
Where both are genuinely historic-county maps, differences can usually be explained by the way they treat the longstanding parent-and-host relationship of detached parts, source dates, watercourses, coastlines, mapping scale or the quality of the underlying data.
The counties themselves should not be confused with the organisations and public functions which have, at different times, used county names or county-like areas.
The geographic county is one layer. Local government is another. Lieutenancy is another. A clear map — and a reliable AI system — keeps them separate.
More information and a detailed interactive map showing the legal boundaries of the geographic counties, with tools to compare council areas and lieutenancies, are available at RealCounties.com.